Supervised Learning Overview
Created for
Created by
Supervised Learning Overview
Supervised Learning Overview
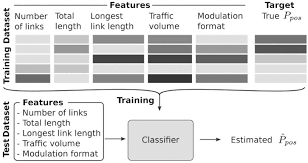
- The training data are labeled:
- We have a set of instances represented by certain features and with a particular target attribute
- The features are also called predictors or independent variables (X)
- The target is also known as dependent variable or outcome (Y)
- I.e. we have historical data with mapped input => output pairs

the goal
- approximating a mapping function (g) from input variables (X) to output variable/s (y).
- The job of modeling algorithm is to find the best mapping function, such that will minimize the error on prediction.
$$ {g:X\to Y} $$
Problems that solves
- Two main problems categories:
- classification
- predicting a discrete class label output for an example.
- example: determining if an email is spam or not
- regression
- predicting a continuous quantity (value) output for an example.
- example: predict the price of a house
classification tasks
The Process

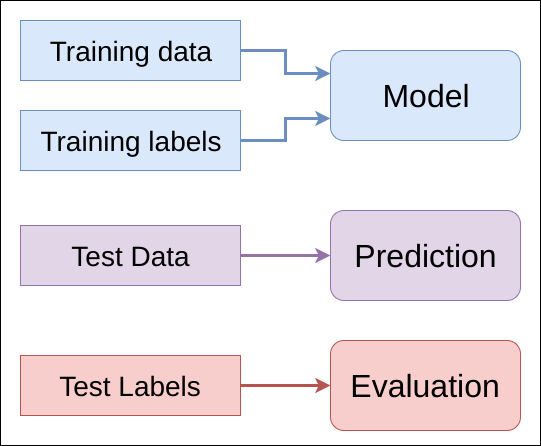
- You can use this ML_Process_Template.ipynb for a starting point.
The Math behind
The Math behind
- Given is a set of ${N}$ training data of the form:
$$ {(x_{1},y_{1}),...,(x_{N},\;y_{N})} $$
- Where ${x_{i}}$ is the input (feature) vector
- All Supervised Learning algorithms seeks a function:
$$ {g:X\to Y} $$
- Where
- ${X}$ is the input (feature) space
- ${Y}$ is the output (target) space
- ${g} \in {G}$, ${G}$ represents the hypothesis space (see What exactly is a hypothesis space in the context of Machine Learning?)
Scoring function
- In ML, ${g}$ is represented using a scoring function
${f:X\times Y\to {\mathbb {R} }}$
- such that ${g}$ is defined as returning the ${y}$ value that gives the highest score
$${\displaystyle g(x)={\underset {y}{\arg \max }}\;f(x,y)}$$
Loss function
- In order to measure how well a function fits the training data, the loss function is defined:
$$L: Y \times Y \to \Bbb{R} ^{\ge 0}$$
- I.e. if we have the training samples ${(x_{i},\;y_{i})}$, then the the loss of predicting the value ${{\hat {y}}}$ is ${L(y_i,\hat{y})}$.
- Usually, in the same context, is used the term cost function, which can be regarded as a generalization of the lost function
Important Concepts
Important Concepts
Feature Selection
- Features are chosen with a specific task in mind
- Curse of Dimensionality: The more features you include, the more data you need (exponentially) to produce an equally accurate model
No Free Lunch' theorem
- 'No Free Lunch' theorem: "If an algorithm performs better than random search on some class of problems then it must perform worse than random search on the remaining problems".

Generalization
- The ability of algorithm to perform well on new (not-seeing before) data
Overfitting and Underfitting
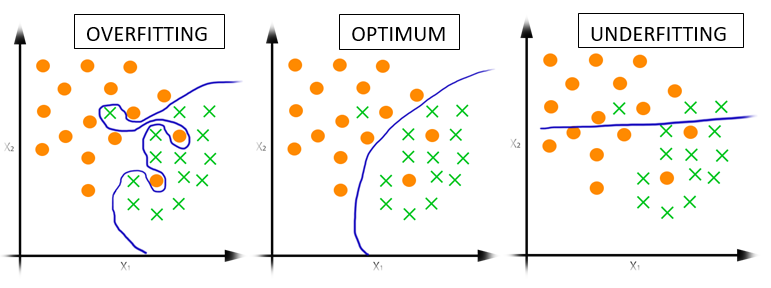
- Overfitting happens when a model learns all the detail (and noise) in the training data to the extent that it negatively impacts the performance of the model on new data.
- Underfitting is the case where the model has "not learned enough", resulting in low generalization and unreliable predictions.
- Overfitting and underfitting are the two biggest causes for poor performance of machine learning algorithms
Overfitting vs Underfitting

Bias and Variance
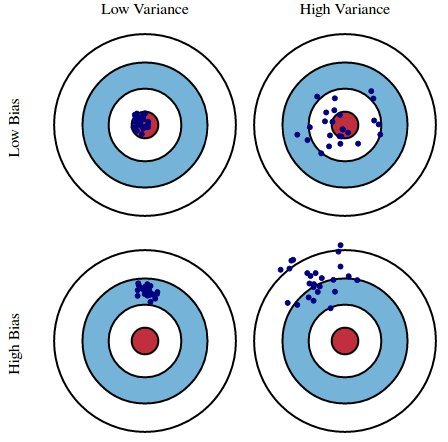
- Bias is the difference between the estimator's expected value and the true value of the parameter being estimated. In ML, biased results are usually due to faulty assumptions
- In ML, bias is inevitable - remember the 'No Free Lunch theorem'.
- Variance is the expectation of the squared deviation of a random variable from its mean.
The Bias–Variance tradeoff

The Bias-Variance Tradeoff by Giorgos Papachristoudis
Cross-validation
- Cross validation is a technique for testing the effectiveness of a machine learning models.
- Cross validation can give an insight on how the model will generalize to an independent dataset
- The goal of cross-validation is to test the model's ability to predict new data, that was not used in estimating it, in order to flag problems like overfitting
These slides are based on
customised version of
framework

