Keyboard shortcuts:
N/SpaceNext Slide
PPrevious Slide
OSlides Overview
ctrl+left clickZoom Element
If you want print version => add '
?print-pdf' at the end of slides URL (remove '#' fragment) and then print.
Like: https://progressbg-python-course.github.io/...CourseIntro.html?print-pdf
Data science basics. Working with Numpy, Pandas and Jupyter Notebooks
Created for
Iva E. Popova, 2016-2025,

Introduction
What is Data Science
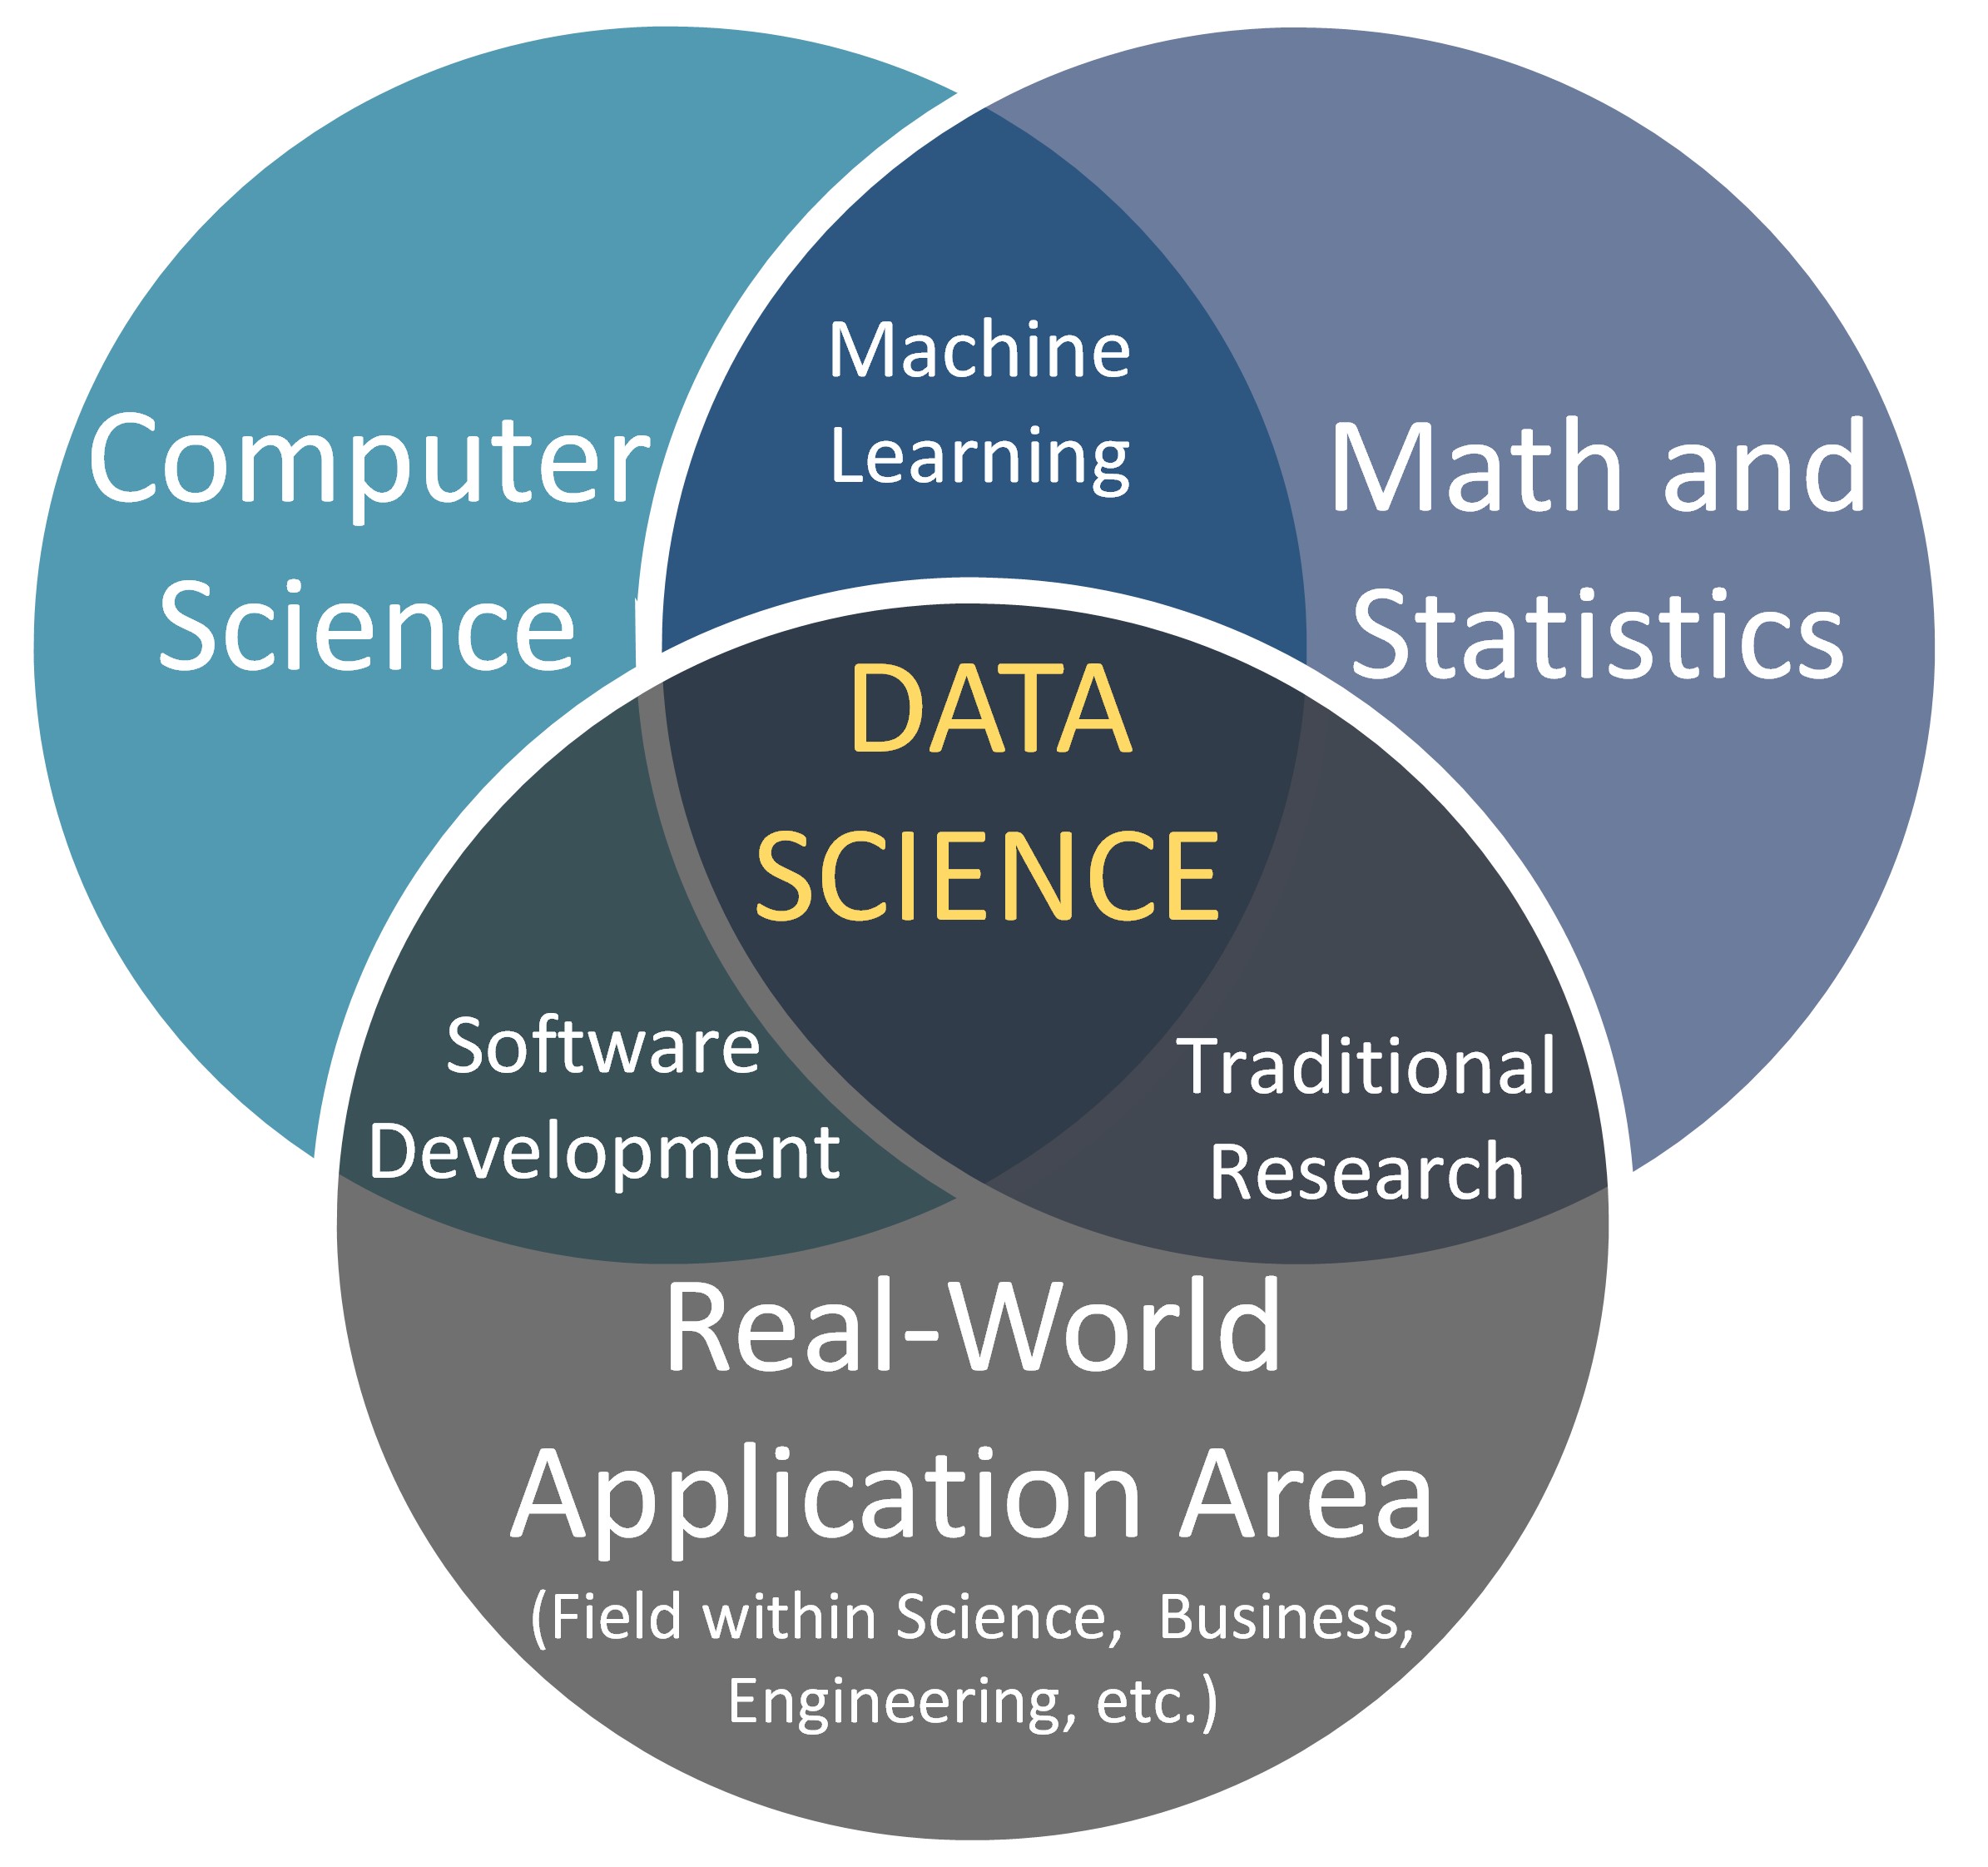
- Data Science is an interdisciplinary field that combines statistics, computer science, and domain knowledge to extract meaningful insights from data.
The Data Science Workflow (Simplified)
- Data Acquisition: Gathering data from various sources.
- Data Cleaning and Preprocessing: Handling missing values, errors, and transforming data into a usable format.
- Exploratory Data Analysis (EDA): Understanding the data through visualization and statistical summaries.
- Modeling and Algorithm Development: Building predictive or descriptive models using machine learning or statistical techniques.
- Evaluation and Interpretation: Assessing the performance of the model and drawing meaningful conclusions.
- Deployment and Communication: Applying the insights or deploying the model for practical use and communicating the findings to stakeholders.
Why Python for Data Science?
- Python has become the dominant programming language in the Data Science field due to several key advantages:
- Simplicity and Readability: Python's syntax is clear and easy to learn, making it accessible for beginners.
- Extensive Libraries: A vast ecosystem of powerful libraries specifically designed for data manipulation, analysis, visualization, and machine learning.
- Large and Active Community: This means ample resources, tutorials, and support are available.
- Integration Capabilities: Python can easily integrate with other tools and systems.
- Versatility: Beyond Data Science, Python is used in web development, automation, and more.
Core Python Libraries for Data Science
Core Python Libraries for Data Science
Overview
- NumPy for numerical computing
- Pandas for data manipulation
- Matplotlib & Seaborn for data visualization
- Scikit-learn for machine learning
- TensorFlow & PyTorch for deep learning
Setting Up the Environment
- Create and activate the virtual environment for your DataScience projects
- Install the necessary libraries using
- You can also use Jupyter Notebook for an interactive coding experience:
- Note, that VSCode supports working with Jupyter Notebooks: Jupyter Notebooks in VS Code
- Make sure you have installed the Jupyter extension from Microsoft.s
                # Create
                python -m venv .venv

                # Activate (CMD)
                .venv\Scripts\activate.bat
pip install numpy pandas matplotlib seaborn scikit-learn
pip install jupyterlab
NumPy (Numerical Python)
NumPy (Numerical Python)
Overview
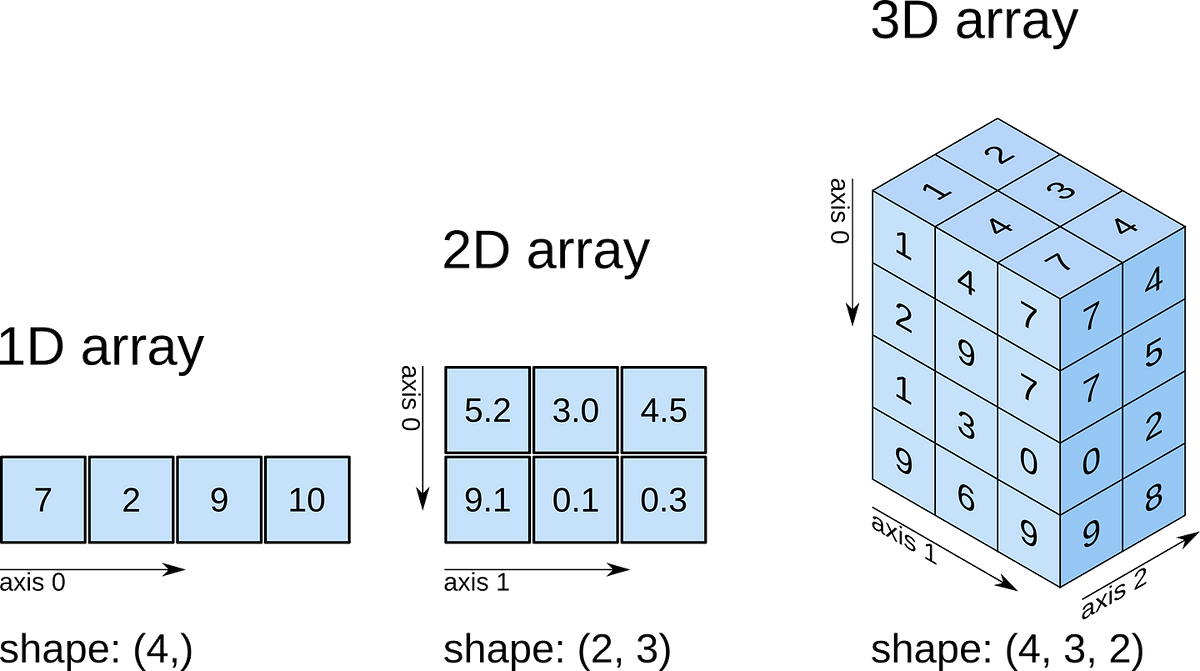
- Provides support for large, multi-dimensional arrays and matrices, along with a collection of high-level mathematical functions to operate on these arrays.
- Foundation for many other scientific computing libraries.
Example
- Performing mathematical operations on arrays efficiently
                import numpy as np

                # Create a NumPy array
                array = np.array([1, 2, 3, 4, 5])
                print(array)

                # Basic operations
                print(array + 5)  # Element-wise addition
                print(array * 2)  # Element-wise multiplication

                # Multi-dimensional arrays
                matrix = np.array([[1, 2, 3], [4, 5, 6], [7, 8, 9]])
                print(matrix)
Resources
- NumPy Full Python Course - Data Science Fundamentals
Pandas
Pandas
Overview
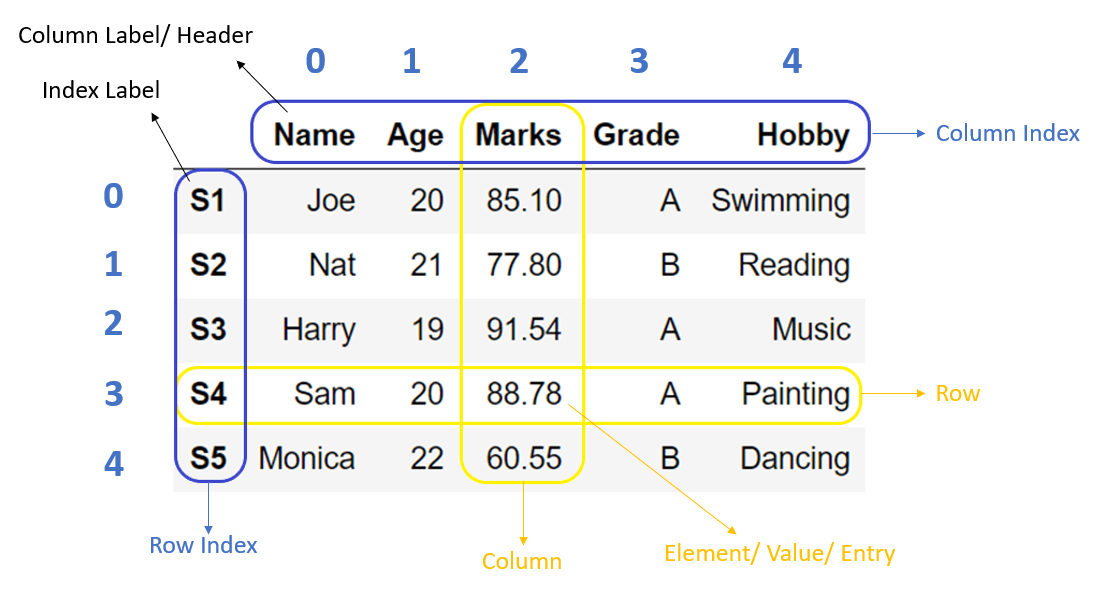
- Offers powerful data structures for data analysis, primarily the DataFrame.
- Provides tools for data manipulation, cleaning, filtering, merging, and more.
- Makes working with tabular data (like spreadsheets or SQL tables) incredibly easy.
Example
                import pandas as pd

                # Create a DataFrame
                data = {
                    'Name': ['Alice', 'Bob', 'Charlie', 'David'],
                    'Age': [25, 30, 35, 40],
                    'Department': ['HR', 'IT', 'Finance', 'Marketing']
                }

                df = pd.DataFrame(data)
                print(df)

                # Basic operations
                print(df.describe())  # Statistical summary
                print(df['Age'].mean())  # Mean of Age column
                print(df[df['Age'] > 30])  # Filter rows where Age > 30
Data Handling with Pandas
- Examples are given in next Jupyter Notebook: Pandas_data_handling.ipynb
Resources
- Python Pandas Tutorial (Part 1): Getting Started with Data Analysis - Installation and Loading Data
Data Visualization
Data Visualization
Matplotlib
- A comprehensive library for creating static, interactive, and animated visualizations in Python.
- Provides a wide range of plot types (line plots, scatter plots, bar charts, histograms, etc.).
- Often used in conjunction with Pandas for visualizing data.
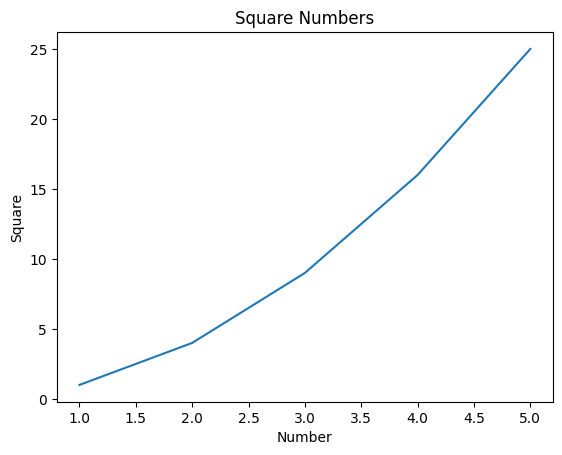
Example: Creating a simple line plot with Matplotlib
                import matplotlib.pyplot as plt

                # Simple line plot
                x = [1, 2, 3, 4, 5]
                y = [1, 4, 9, 16, 25]

                plt.plot(x, y)
                plt.title('Square Numbers')
                plt.xlabel('Number')
                plt.ylabel('Square')
                plt.show()
Example: Plotting DataFrame with Matplotlib
- Examples are given in next Jupyter Notebook: Matplotlib_examples.ipynb
Resources
- Matplotlib Tutorial (Part 1): Creating and Customizing Our First Plots
These slides are based on
customised version of
framework