Keyboard shortcuts:
N/СпейсNext Slide
PPrevious Slide
OSlides Overview
ctrl+left clickZoom Element
If you want print version => add '
?print-pdf' at the end of slides URL (remove '#' fragment) and then print.
Like: https://progressbg-python-course.github.io/...CourseIntro.html?print-pdf
Debugging Python applications
Created for
Iva E. Popova, 2016-2025,

Introduction to Debugging
- What is Debugging?
- Debugging is the process of identifying and fixing errors, or bugs, in software code.
- Importance of Debugging
- Effective debugging ensures that software functions correctly, improving reliability and user satisfaction.
- Common Causes of Bugs
- Bugs can arise from syntax errors, logical errors, or unexpected behavior of libraries and dependencies.
Debugging with Print Statements
Debugging with Print Statements
- You can trace your code by putting a print statements in the problematic places
- Pros:
- Easy to use
- Cons:
- You have to remove them in production ready code
- Too much useless typing
- Example:
- Consider a function that calculates the factorial of a number. Adding print statements can help identify issues:
                def factorial(n):
                    result = 1
                    for i in range(1, n+1):
                        result *= i

                        # trace the values of i and result:
                        print(f"i: {i}, result: {result}")

                    return result

                print(factorial(5))

                # i: 1, result: 1
                # i: 2, result: 2
                # i: 3, result: 6
                # i: 4, result: 24
                # i: 5, result: 120
                # 120
The Logging Module
The Logging Module
Overview
- The logging module provides a flexible framework for logging messages from Python applications.
- While print statements and debugger tools are helpful for inspecting code execution during development, logging offers a more systematic and flexible approach to tracking the flow of execution, identifying errors, and monitoring the behavior of an application in production environments. Here's why logging is beneficial for debugging:
- Persistent Output: Unlike print statements, which output information to the console during runtime, logging allows you to store messages in files or other destinations, providing a persistent record of the application's behavior. This is particularly useful for debugging issues that occur intermittently or in production environments where real-time monitoring is necessary.
- Multiple Log Levels: The logging module in Python supports different log levels (e.g., DEBUG, INFO, WARNING, ERROR, CRITICAL), allowing you to categorize messages based on their severity. This enables developers to focus on relevant information during debugging while filtering out less important details.
- Configuration Options: Python's logging module provides extensive configuration options, allowing you to customize log formatting, output destinations (e.g., files, streams, sockets), and filtering mechanisms. This flexibility makes it easy to adapt logging to different debugging scenarios and environments.
- Integration with Libraries: Many third-party libraries and frameworks in the Python ecosystem use the logging module for their own logging purposes. By leveraging a consistent logging approach across your entire application stack, you can streamline debugging and troubleshooting efforts, especially in complex projects with multiple dependencies.
Example: log to file
- Here is the content of "factorial.log":
                import logging

                # Configure logging
                logging.basicConfig(filename='factorial.log', level=logging.DEBUG)

                def factorial(n):
                    result = 1
                    for i in range(1, n+1):
                        result *= i
                        logging.debug(f"i: {i}, result: {result}")
                    return result

                print(factorial(5))
                DEBUG:root:i: 1, result: 1
                DEBUG:root:i: 2, result: 2
                DEBUG:root:i: 3, result: 6
                DEBUG:root:i: 4, result: 24
                DEBUG:root:i: 5, result: 120
Example: output messages to both a log file and the console:
                import logging

                # Configure logging to output messages to both console and file
                logging.basicConfig(level=logging.DEBUG,
                                    handlers=[
                                        logging.FileHandler('example.log'), # write log messages to a file
                                        logging.StreamHandler()]            # output log messages to the console
                                    )

                def factorial(n):
                    result = 1
                    for i in range(1, n+1):
                        result *= i
                        logging.debug(f"i: {i}, result: {result}")
                    return result

                def main():
                    logging.info("Starting factorial calculation...")

                    result = factorial(5)

                    logging.info(f"Factorial of 5 is: {result}")

                if __name__ == "__main__":
                    main()
Logging Levels
- DEBUG
- Detailed information, typically of interest only when diagnosing problems.
- INFO
- Confirmation that things are working as expected.
- WARNING
- An indication that something unexpected happened, but the software is still functioning as expected.
- ERROR
- A more serious problem that might cause the application to malfunction.
- CRITICAL
- A critical error that could lead to application failure.
Logging Hierarchy
- The levels are hierarchically ordered from least severe (DEBUG) to most severe (CRITICAL).
- DEBUG < INFO < WARNING < ERROR < CRITICAL
- By setting the logging level, messages of that level and higher in the hierarchy will be logged.
- Example
- If the logging level is set to WARNING, only messages with WARNING level and above will be logged.
                import logging

                # Configure logging to output messages to console
                logging.basicConfig(level=logging.WARNING)

                # Log messages at different levels
                logging.debug("Debug message - Detailed information for debugging purposes")
                logging.info("Info message - Confirmation that things are working as expected")
                logging.warning("Warning message - Something unexpected happened, but the software is still functioning")
                logging.error("Error message - A more serious problem that might cause the application to malfunction")
                logging.critical("Critical message - A critical error that could lead to application failure")


                # WARNING:root:Warning message - Something unexpected happened, but the software is still functioning
                # ERROR:root:Error message - A more serious problem that might cause the application to malfunction
                # CRITICAL:root:Critical message - A critical error that could lead to application failure
- The Logging Format controls the structure and style of log messages, including timestamp, log level, and message content.
- Developers can customize the logging format according to their specific requirements by specifying the desired components and their arrangement using format placeholders.
- Typical elements include timestamp, log level, module name, function name, and message content.
- Example - set up logging with a custom format:
                import logging

                # Configure logging with custom format
                logging.basicConfig(format='%(asctime)s - %(levelname)s - %(message)s', level=logging.DEBUG)

                # Log messages
                logging.debug("Debug message")
                logging.info("Info message")
                logging.warning("Warning message")
                logging.error("Error message")
                logging.critical("Critical message")


                # 2025-03-26 12:19:48,626 - DEBUG - Debug message
                # 2025-03-26 12:19:48,626 - INFO - Info message
                # 2025-03-26 12:19:48,626 - WARNING - Warning message
                # 2025-03-26 12:19:48,627 - ERROR - Error message
                # 2025-03-26 12:19:48,627 - CRITICAL - Critical message
Debug Python with VS Code
Debug Python with VS Code
Overview
- The Python extension supports debugging of a number of types of Python applications, including the following general capabilities:
- Breakpoints: Set breakpoints in your code to pause execution and inspect variables.
- Step Through Code: Step through your code line by line using step into, step over, and step out commands.
- Watch and Variables: View and monitor variable values in real-time using watch and variables views.
- Debug Console: Execute Python code and evaluate expressions interactively in the debug console.
- Reference: Python debugging in VS Code
Start Debugger
- You can start VS Code debugger by:
- Pressing F5 or
- From Activity Panel cick on "Run and Debug" icon
- When you start VS Code Debugger for the first time, or if you don't yet have any configurations defined, you'll see a button to Run and Debug and a link to create a configuration (launch.json) file:
- A configuration drives VS Code's behavior during a debugging session. Configurations are defined in a launch.json file that's stored in a .vscode folder in your workspace.
- If you're only interested in debugging a Python script, the simplest way is to select the down-arrow next to the run button on the editor and select Python Debugger: Debug Python File.
- Reference: Initialize configurations
Debug actions
- Reference: Debug actions
| Command | Keyboard Shortcut |
|---|---|
| Continue / Pause | F5 |
| Step Over | F10 |
| Step Into | F11 |
| Step Out | Shift+F11 |
| Restart | Ctrl+Shift+F5 |
| Stop | Shift+F5 |
Breakpoints
- Breakpoints can be toggled by clicking on the editor margin
- Clicking with right mouse button on the editor margin allows to add "Normal Breakpoint", "Conditional Breakpoint", "Log Point"
- Conditional Breakpoints will be hit whenever the expression evaluates to true
- Finer breakpoint control (enable/disable/reapply) can be done in the Debug view's BREAKPOINTS section
- Breakpoints in the editor margin are normally shown as red filled circles.
- Reference: Breakpoints
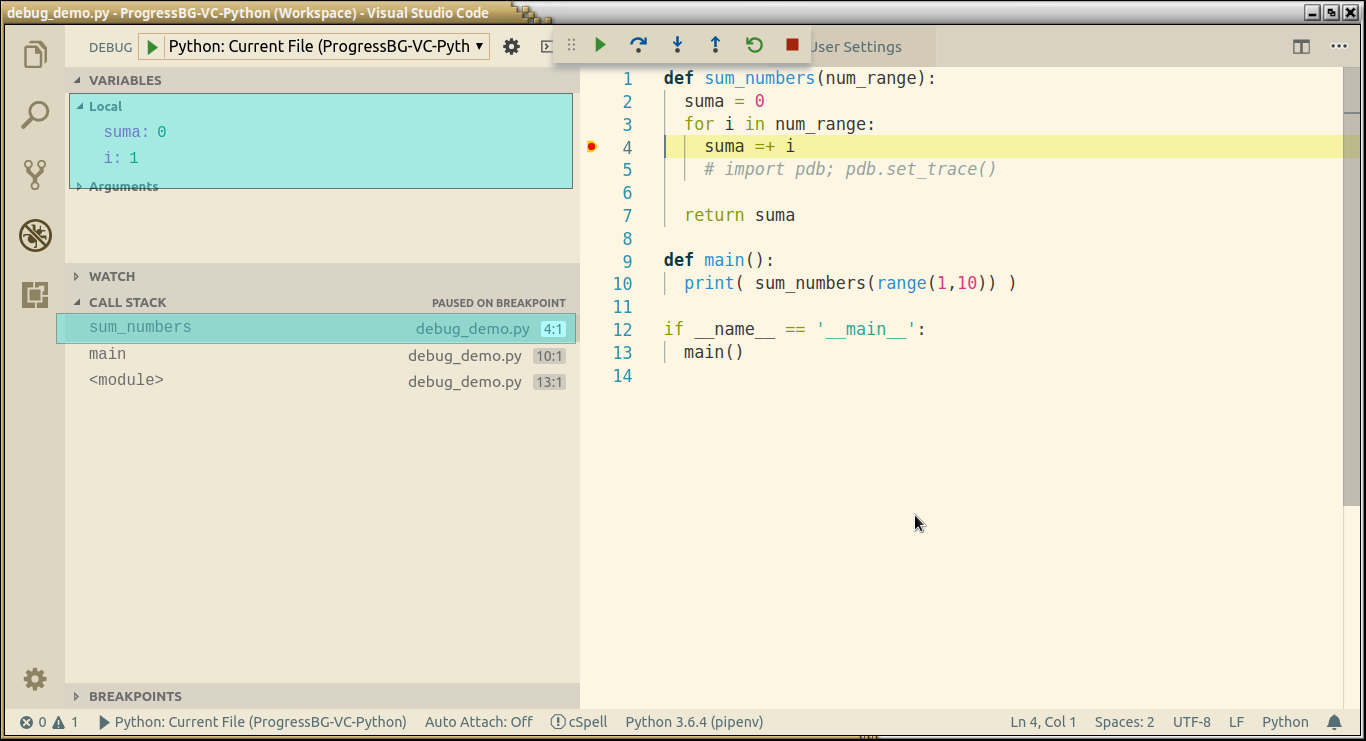
Data inspection
- Variables can be inspected in the VARIABLES section of the Debug view or by hovering over their source in the editor.
- Variables and expression evaluation is relative to the selected stack frame in the CALL STACK section.
- Reference: Data inspection
These slides are based on
customised version of
framework